4 垂直に交わる線
直交する直線の傾き
ある直線に別の直線が直角に交わった状態を直交という
直交する2直線は、片方が右上がり、もう一方が右下がりになる
2つの直線を方程式で表すと
\(y=a1\times x+b\) と \(y=a2\times x+b (a2<0,a1\times a2=-1)\) となる
直線が直交するときに成り立つ法則
直線の交点を原点nに重ねると 切片 b は 0 となる
2つの直線は \(y=a1\times x\) と \(y=a2\times x\) になる
\(x=1\) を通る直線を補助線として描く
ピタゴラスの定理 直角三角形の斜辺の長さの2乗は、残りの2辺の長さを2乗して足したものと等しい を当てはめる
\(-y=a1\times x\) と x軸 が作る三角形から (0, 0)と(1, a1) の間の斜辺の長さ l1 を求めると
\(-l1^2=1^2+a1^2\) … ①
\(y=a2\times x\) と x軸 が作る三角形から (0, 0)と(1, a2) の間の斜辺の長さ l2 を求めると
\(l2 ^ 2 = 1 ^ 2 + a2 ^ 2\) … ②
\(y = a1 \times x\) と \(y = a2 \times x\) は直交するので (0, 0) と (1, a1), (1, a2) の三角形も直角三角形
$ a1 ^ 2 - a2 ^ 2 = li ^ 2 + l2 ^ 2$
$ (a1 - a2) ^ 2 = li ^ 2 + l2 ^ 2$ … ③
③ に ①、② を代入すると
$ (a1 - a2) ^ 2 = (1 ^ 2 + a1 ^ 2) + (1 ^ 2 + a2 ^ 2)$
$ (a1 - a2) ^ 2 = a1 ^ 2 + a2 ^ 2 + 2$
\(a1 ^ 2 - 2 \times a1 \times a2 + a2 ^ 2 = a1 ^ 2 + a2 ^ 2 + 2\)
\(\times a1 \times a2 = 2\)
\(\times a2 = -1\)
2つの直交する直線の傾きの積は -1 となる
import sympy as sp

a1 = sp.Symbol('a1')
a2 = sp.Symbol('a2')

expr = sp.Eq((a1 - a2) ** 2, (1 ** 2 + a1 ** 2 ) + (1 ** 2 + a2 ** 2 ))

expr
sp.expand(expr)
expr2 = ((1 ** 2 + a1 ** 2 ) + (1 ** 2 + a2 ** 2 ) - (a1 - a2) ** 2)
expr2
# simplify を実行して式を整理する
sp.simplify(expr2)
直線の垂直条件
2つの直交する直線の傾きの積は \(-1\) となる
\(a1 \times a2 = -1\) から \(a2 = -\dfrac{1}{a1}\)
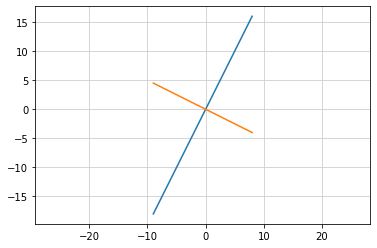
傾き \(a1\) に直交する直線の傾きは \(-\dfrac{1}{a1}\) となる
\(a1 = 5\) に直交する直線の傾きは \(-\dfrac{1}{5}\)
%matplotlib inline
import matplotlib.pyplot as plt
import numpy as np

def func1(x):
    return 2 * x

def func2(x):
    return -1 / 2 * x

x = np.arange(-9, 9)

y1 = func1(x)
plt.plot(x, y1)

y2 = func2(x)
plt.plot(x, y2)

plt.axis('equal')
plt.grid(color = '0.8')
plt.show()
直線と線分
「まっすぐな線」は直線だけでない
線分も「まっすぐな線」である
直線 … どこまでもまっすぐに伸びる線
線分 … まっすぐな線の両端が定まっているもの
線分には長さがあり、直線にはない
点A(x1, y1) と 点B(x2, y2) とを結ぶ直線
x方向は \(x2 - x1\)、y方向は \(y2 - y1\) で長さを求める事ができる
線分の 中点C は 点A、点B から等距離にある
点C は \((\dfrac{x2 + x1}{2},\dfrac{y2 + y1}{2})\) となる … 途中式省略
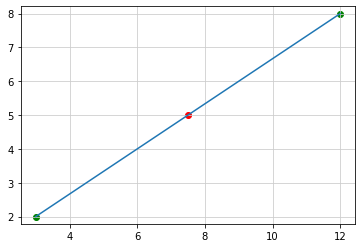
点A(3, 2)、点B(12, 8) の場合
直線式 \(y = ax + b\) から 線分AB の 傾き a を求めると
\(8 - 2 = a\times (12 -3)\)
\(a = \dfrac{2}{3}\)
切片 b は
\(2 = \dfrac{2}{3} \times 3 + b\)
\(b = 0\)
中点c は
\((\dfrac{15}{2}, \dfrac{10}{2})\)
%matplotlib inline
import matplotlib.pyplot as plt
import numpy as np

def func(x):
    return (2 / 3)  * x

x = np.arange(3, 13)
y = func(x)

plt.plot(x, y)
plt.axis('equal')
plt.grid(color = '0.8')
plt.scatter(3, 2, color = 'g')
plt.scatter(12, 8, color = 'g')
plt.scatter(15 / 2, 10 / 2, color = 'r')
plt.show()
線分を m : n に分ける点の座標
線分を2つに分ける点を内分点という
中点も内分点のひとつ
線分を一定の割合\((m:n)\)に分ける内分点を考える
x軸と平行な 線分AB を \(m:n\) に分ける 内分点C は、\(A(x1, 0), B(x2, 0), C(x, 0)\) とすると
\(m:n = x - x1:x2 - x\)
比例式には 内項の積と外項の積は等しい ということから
\(m \times (x2 - x) = n \times (x - x1)\)
import sympy as sp

x = sp.Symbol('x')
x1, x2 = sp.symbols('x1, x2')
m, n = sp.symbols('m, n')

expr = sp.Eq(m * (x2 - x), n * (x - x1))

display(expr)
display(sp.solve(expr, x))

# 線分AB を m:n に内分する 点C の座標は
# 点A(x1,y2), 点B(x2, y2)とすると
# C((m * x2 + n * x1) / (m + n), (m * y2 + n * y1) / (m + n))
[(m*x2 + n*x1)/(m + n)]
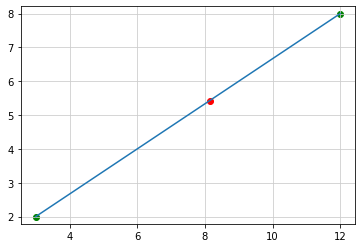
# 点A(3, 2), 点B(12,8) を結ぶ直線を 4:3 の内分する 点C(x,y)は

%matplotlib inline

import matplotlib.pyplot as plt
import numpy as np
import sympy as sp

x1 = 3
y1 = 2
x2 = 12
y2 = 8
m = 4
n = 3

a = (y2 - y1) / (x2 - x1)
b = -(a * (x1 + x2) - (y1 + y2)) / 2

x = np.arange(x1, x2 + 1)
y = a * x + b

x3 = (m * x2 + n * x1) / (m + n)
y3 = (m * y2 + n * y1) / (m + n)

plt.plot(x, y)
plt.axis('equal')
plt.grid(color = '0.8')
plt.scatter(x1, y1, color = 'g')
plt.scatter(x2, y2, color = 'g')
plt.scatter(x3, y3, color = 'r')
plt.show()
# n(x - x1) = m(x2 -x) の式を x について解く

x = sp.Symbol('x')
x1, x2 = sp.symbols('x1, x2')
m, n = sp.symbols('m, n')

expr = sp.Eq(n * (x - x1), m * (x2 -x))
display(expr)
display(sp.solve(expr, x))
[(m*x2 + n*x1)/(m + n)]
# 分数を分数として表示する
# SymPyモジュール の init_printing() を実行する

sp.init_printing()
display(sp.solve(expr, x))
垂直二等分線の式
\(a1 \times a2 = -1\) … ① 直線の垂直条件
\((\dfrac{x1 + x2}{2},\dfrac {y1 + y2}{2})\) … ② 線分の中点
式① と 式② とを組み合わせる
与えられた線分の中点を通り直角に交わる直線の式をあらわすことができる
このような直線を 垂直二等分線 という
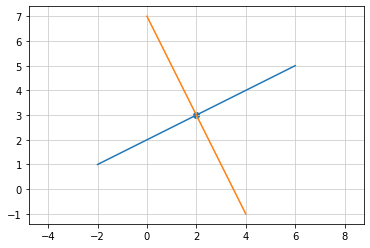
点A(-2, 1) と 点B(6, 5) とを結ぶ線分の傾きは (yの増加分 \(\div\) xの増加分)
\(\dfrac{5 - 1}{ (6 - (-2))}\) となり \(a1 = \dfrac{1}{2}\)
直線の垂直条件から \(a2 = -2\)
線分の中点の座標Cは \((2, 3)\)
垂直二等分線の式は \(y = a2\times (x - cx) + cy\)
\(y = -2 \times (x - 2) + 3\)
\(y = -2 \times x + 7\)
# 点A(-2, 1) と 点B(6, 5) を結ぶ線分とその垂直二等分線 y = 2x + 7 のグラフ

%matplotlib inline
import matplotlib.pyplot as plt
import numpy as np
import sympy as sp


# 線分と中点
plt.plot([-2, 6], [1, 5])    # 点A と 点B とを結ぶ線分
plt.scatter(2, 3)            # 線分の中点

# 垂直二等分線
def func(x):
      return - 2 * x + 7

x = np.arange(0, 5)
y = func(x)

plt.plot(x, y)

# 画面に表示
plt.axis('equal')
plt.grid(color = '0.8')
plt.show()
円に接する線
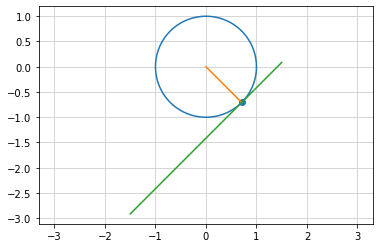
円外の点Aから円内を通る直線を引くと円周上の2点と交わる
円周上の1点を通る直線を円の接線といい、円と直線が接する点を接点という
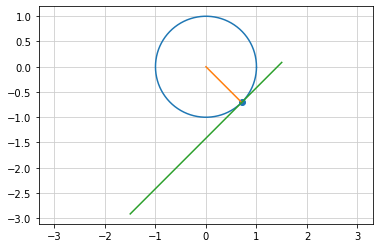
接線には円の中心を結ぶ半径と直交する
# 原点を中心とする半径1の円と接線

%matplotlib inline
import matplotlib.pyplot as plt
import numpy as np
import sympy as sp

# 円
th = np.arange(0, 360)

x = np.cos(np.radians(th))
y = np.sin(np.radians(th))

plt.plot(x, y)

# 接点
th = 315

x1 = np.cos(np.radians(th))
y1 = np.sin(np.radians(th))

plt.scatter(x1, y1)

# 円の中心と接点を結ぶ線分
plt.plot([0, x1], [0, y1])

a1 = y1 / x1

# 接線
a2 = -1 / a1

def func(x):
    return a2 * (x - x1) + y1

x = np.arange(-1.5, 2)
y = func(x)

plt.plot(x, y)

plt.axis('equal')
plt.grid(color = '0.8')
plt.show()

# 変数th は接点を指定している
# 変数th に値を代入すると 接点と接線はx軸の正方向(1, 0)を基点にして反時計回りに移動する
三角比を使って円を描く
直角三角形で直角以外の1つの 角θ の大きさを決めると三角形の形が決まる
角θ の大きさによって直角三角形を構成する3辺の長さの比が決まる
直角三角形の3辺の長さを a, b, c とする
a:c は sinθ、b:c は cosθ、a:b は tanθ と表せる
sinθ = a / c
cosθ = b / c
tanθ = a / b
主な三角関数表
角度(deg) |
sin |
cos |
tan |
0 |
0 |
1 |
0 |
30 |
-0.5 |
0.866 |
0.5744 |
45 |
0.7071 |
0.7071 |
1 |
60 |
0.866 |
0.5 |
1.7321 |
90 |
1 |
0 |
%matplotlib inline
import matplotlib.pyplot as plt
import numpy as np
import sympy as sp

# 円
th = np.arange(0, 360)

x = np.cos(np.radians(th))
y = np.sin(np.radians(th))

plt.plot(x, y)

# 接点
th = 315

x1 = np.cos(np.radians(th))
y1 = np.sin(np.radians(th))

plt.scatter(x1, y1)

# 円の中心と接点を結ぶ線分
plt.plot([0, x1], [0, y1])

a1 = y1 / x1

# 接線
a2 = -1 / a1

def func(x):
    return a2 * (x - x1) + y1

x = np.arange(-1.5, 2)
y = func(x)

plt.plot(x, y)

plt.axis('equal')
plt.grid(color = '0.8')
plt.show()
半径1の円 を単位円という
- 原点を中心とする単位円の円周上にある 点P(x,y) と 円の中心を結ぶ線分と
x軸 が作る角度を θ とする
cosθ = x / 1
sinθ = y / 1
点p の座標は (cosθ,sinθ) となる
Numpyモジュール に定義されている sin()、cos() は、引数として指定する角度はラジアン(弧度法の単位) ^ Numpyモジュール の radians() で変換を行う
弧度法では 円弧の長さ(l) と 円の半径(r) との比で 角度(θ) を表す
θ = 1 / r となる
どこまでも交わらない2直線
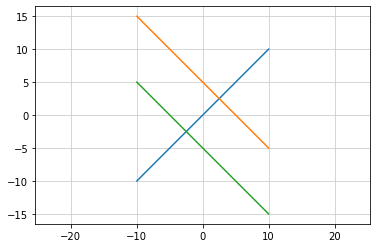
\(y = a \times x + b\) に直行する2つの直線は、どこまでも交わることがない
2つの直線の式
\(y = a1 \times x + b1\)
\(y = a2 \times x + b2\)
直線の直交条件から
\(a1 = a2 = -\dfrac{1}{a}\)
直線の平行条件により
\(a1 = a2\)
%matplotlib inline
import matplotlib.pyplot as plt
import numpy as np

a = 1
b = 0
b1 = b + 5
b2 = b - 5

# y = a * x + b
def func(x):
    return a * x + b

# y = a1 * x + b1
def func1(x):
    return (-1 / a) * x + b1

# y = a2 * x + b2
def func2(x):
    return (-1 / a) * x + b2

x = np.arange(-10, 11)
y = func(x)
y1 = func1(x)
y2 = func2(x)

plt.plot(x, y)
plt.plot(x, y1)
plt.plot(x, y2)

plt.axis('equal')
plt.grid(color = '0.8')
plt.show()
