6 2点から等距離にある直線
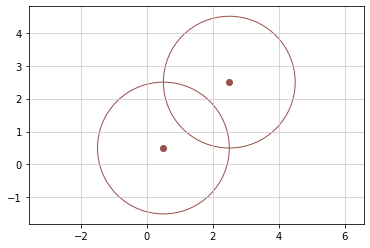
2点から等しい距離に点を打つ
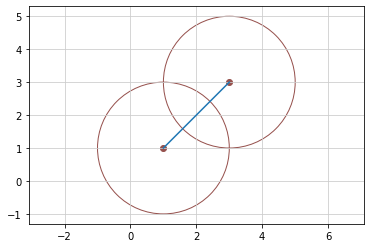
2点を中心とした2つの円が交わるように半径を設定して描く
2つの円の交点までの中心からの距離は両円の半径となり等しい
# -*- coding: utf-8 -*-
import matplotlib
import matplotlib.pyplot as plt
import numpy as np

# グラフ画像の保存先ファイルパス
save_fig_path = "./data/L006-01_1.png"

fig = plt.figure()
ax = fig.add_subplot(111)

# 中心(0.5,0.5)で半径2の円を描画
circle = plt.Circle((0.5,0.5), 2, ec='#96514d', fill=False)
ax.add_patch(circle)


# 中心(2.5,2.5)で半径2の円を描画
circle = plt.Circle((2.5,2.5), 2, ec='#96514d', fill=False)
ax.add_patch(circle)

plt.grid(color = '0.8')
plt.axis('equal')
plt.scatter(0.5, 0.5, color = '#96514d')
plt.scatter(2.5, 2.5, color = '#96514d')
plt.show()

# グラフをファイルに保存
fig.savefig(save_fig_path)
# -*- coding: utf-8 -*-
import matplotlib
import matplotlib.pyplot as plt
import numpy as np
import sympy as sp
import math

# グラフ画像の保存先ファイルパス
save_fig_path = "./data/L006-01_2.png"

fig = plt.figure()
ax = fig.add_subplot(111)

# 中心(0.5,0.5)で半径2の円を描画
circle = plt.Circle((1, 1), 2, ec='#96514d', fill=False)
ax.add_patch(circle)

# 中心(2.5,2.5)で半径2の円を描画
circle = plt.Circle((3, 3), 2, ec='#96514d', fill=False)
ax.add_patch(circle)

x = [1, 3]
y = x

plt.plot(x, y)
plt.grid(color = '0.8')
plt.axis('equal')
plt.scatter(1, 1, color = '#96514d')
plt.scatter(3, 3, color = '#96514d')
plt.show()

# グラフをファイルに保存
fig.savefig(save_fig_path)
2点から等距離にある直線の式
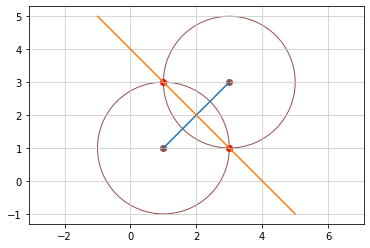
点A(x1, y1)、点B(x2, y2)から等距離にある点P
ピタゴラスの定理により
AP = ((x - x1) ** 2 + ( y- y1) ** 2) ** 0.5BP = ((x - x2) ** 2 + ( y- y2) ** 2) ** 0.5AP = BP2乗して AP ** 2 = BP ** 2 に代入(x - x1) ** 2 + ( y- y1) ** 2 = (x - x2) ** 2 + ( y- y2) ** 2
y について式を解くと 2点から等距離の直線の式 になる
点A(1, 1)、点B(3, 3)として2点から等距離にある直線の式を求める
import sympy as sp
sp.init_printing()

# 記号を定義
x, y = sp.symbols('x, y')

# 値を代入
x1 = 1; y1 = 1
x2 = 3; y2 = 3

# 式を定義(AP ** 2 - BP ** 2 = 0)
expr = ((x - x1) ** 2 + ( y- y1) ** 2) - ((x - x2) ** 2 + ( y- y2) ** 2)
display(expr)
display(sp.simplify(expr))

# 式を y について解く
ans = sp.solve(expr, y)
ans
\[\displaystyle - \left(x - 3\right)^{2} + \left(x - 1\right)^{2} - \left(y - 3\right)^{2} + \left(y - 1\right)^{2}\]
\[\displaystyle 4 x + 4 y - 16\]
\[\displaystyle \left[ 4 - x\right]\]
# -*- coding: utf-8 -*-
import matplotlib
import matplotlib.pyplot as plt
import numpy as np
import sympy as sp
import math

# グラフ画像の保存先ファイルパス
save_fig_path = "./data/L006-01_3.png"

fig = plt.figure()
ax = fig.add_subplot(111)

# 中心(0.5,0.5)で半径2の円を描画
circle = plt.Circle((1, 1), 2, ec='#96514d', fill=False)
ax.add_patch(circle)

# 中心(2.5,2.5)で半径2の円を描画
circle = plt.Circle((3, 3), 2, ec='#96514d', fill=False)
ax.add_patch(circle)

# 2つの円の中心を結ぶ線を描画
x1 = [1, 3]
y1 = x1

# 2つの円の中心と等距離にある直線を描画
def func(x2):
    return 4 - x2

x2 = np.arange(-1, 6)
y2 = func(x2)

plt.plot(x1, y1)
plt.grid(color = '0.8')
plt.axis('equal')
plt.scatter(1, 1, color = '#96514d')
plt.scatter(3, 3, color = '#96514d')
plt.scatter(1, 3, color = 'r')
plt.scatter(3, 1, color = 'r')
plt.show()

# グラフをファイルに保存
fig.savefig(save_fig_path)
### 2点から等距離にある直線の式(一般型) ###

import sympy as sp
sp.init_printing()

# 記号を定義
x, y = sp.symbols('x, y')
x1, y1 = sp.symbols('x1, y1')    # 点A
x2, y2 = sp.symbols('x2, y2')    # 点B

# 式を定義(AP ** 2 - BP ** 2 = 0)
expr = ((x - x1) ** 2 + ( y- y1) ** 2) - ((x - x2) ** 2 + ( y- y2) ** 2)
display(expr)

# 式を y について解く
ans = sp.solve(expr, y)
display(ans)

# 式に値を代入して expr を上書き
expr = expr.subs({x1:1, y1:1, x2:3, y2:3})
display(expr)

# 式を y について解く
ans = sp.solve(expr, y)
ans
\[\displaystyle \left(x - x_{1}\right)^{2} - \left(x - x_{2}\right)^{2} + \left(y - y_{1}\right)^{2} - \left(y - y_{2}\right)^{2}\]
\[\displaystyle \left[ \frac{y_{1}^{2} - y_{2}^{2} + \left(x - x_{1}\right)^{2} - \left(x - x_{2}\right)^{2}}{2 \left(y_{1} - y_{2}\right)}\right]\]
\[\displaystyle - \left(x - 3\right)^{2} + \left(x - 1\right)^{2} - \left(y - 3\right)^{2} + \left(y - 1\right)^{2}\]
\[\displaystyle \left[ 4 - x\right]\]
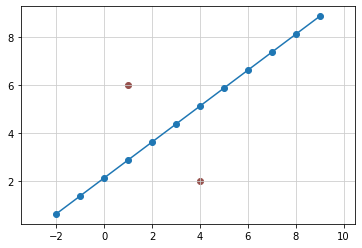
2点から等距離にある直線を描く
# 点(1, 6)、(4, 2)から等距離にある直線を描く

%matplotlib inline
import matplotlib
import matplotlib.pyplot as plt
import numpy as np

# グラフ画像の保存先ファイルパス
save_fig_path = "./data/L006-03_1.png"

fig = plt.figure()
ax = fig.add_subplot(111)

# (1,6)、(4, 2)から等距離にある直線の式
def func(x):
    return 3/4*x + 17/8

# x、yの値
x = np.arange(-2,10)
y = func(x)

# 描画
plt.grid(color = '0.8')
plt.axis('equal')
plt.scatter(1, 6, color = '#96514d')    # 点A
plt.scatter(4, 2, color = '#96514d')    # 点B
plt.plot(x, y, marker='o')    # 2点から等距離にある直線
plt.show()

# グラフをファイルに保存
fig.savefig(save_fig_path)
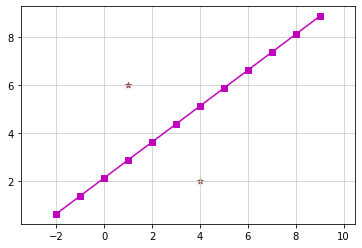
グラフの見た目を変更する
### グラフの見た目を変更する ###
# makerオプション
# o ... ●
# s ... ■
# ^ ... ▲
# x ... ×
# + ... +
# * ... ★
#
# colorオプション
# 1文字で指定 ... r, g, b, y, m, c, k, w
# 色名で指定 ... red, green, blue, yellow, magenta, cyan, black, white
# 16進数で指定 ... #******

# 点(1, 6)、(4, 2)から等距離にある直線を描く

%matplotlib inline
import matplotlib
import matplotlib.pyplot as plt
import numpy as np

# グラフ画像の保存先ファイルパス
save_fig_path = "./data/L006-03_1.png"

fig = plt.figure()
ax = fig.add_subplot(111)

# (1,6)、(4, 2)から等距離にある直線の式
def func(x):
    return 3/4*x + 17/8

# x、yの値
x = np.arange(-2,10)
y = func(x)

# 描画
plt.grid(color = '0.8')
plt.axis('equal')
plt.scatter(1, 6, marker='*', color = '#96514d')    # 点A
plt.scatter(4, 2, marker='*', color = '#96514d')    # 点B
plt.plot(x, y, marker='s', color = 'm')    # 2点から等距離にある直線
plt.show()

# グラフをファイルに保存
fig.savefig(save_fig_path)
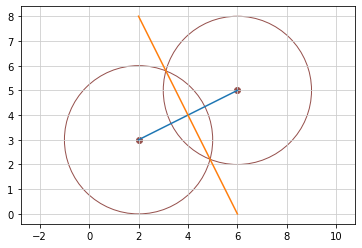
任意の線分の垂直二等分線
線分の中点を通ってその線分と直角に交わる直線
垂直二等分線はコンパスを使って簡単に引ける線分の長さの半分より大きく半径を取る線分の両端を中心として弧を描く2つの弧が交わる点を結ぶ線分が垂直二等分線となる
2点から等距離にある直線と垂直二等分線は同じ
### 2点から等距離にある直線の式(一般型) ###
#

import sympy as sp
sp.init_printing()

# 記号を定義
x, y = sp.symbols('x, y')
x1, y1 = sp.symbols('x1, y1')    # 点A
x2, y2 = sp.symbols('x2, y2')    # 点B

# 式を定義(AP ** 2 - BP ** 2 = 0)
expr = ((x - x1) ** 2 + ( y- y1) ** 2) - ((x - x2) ** 2 + ( y- y2) ** 2)
display(expr)

# 式を y について解く
ans = sp.solve(expr, y)
display(ans)

# 式に値を代入して expr を上書き
expr = expr.subs({x1:2, y1:3, x2:6, y2:5})
display(expr)

# 式を y について解く
ans = sp.solve(expr, y)
ans
\[\displaystyle \left(x - x_{1}\right)^{2} - \left(x - x_{2}\right)^{2} + \left(y - y_{1}\right)^{2} - \left(y - y_{2}\right)^{2}\]
\[\displaystyle \left[ \frac{y_{1}^{2} - y_{2}^{2} + \left(x - x_{1}\right)^{2} - \left(x - x_{2}\right)^{2}}{2 \left(y_{1} - y_{2}\right)}\right]\]
\[\displaystyle - \left(x - 6\right)^{2} + \left(x - 2\right)^{2} - \left(y - 5\right)^{2} + \left(y - 3\right)^{2}\]
\[\displaystyle \left[ 12 - 2 x\right]\]
import sympy as sp

x = sp.Symbol('x')               # 未知数 x
x1, y1 = sp.symbols('x1, y1')    # 点m の座標
x2, y2 = sp.symbols('x2, y2')    # 点n の座標

y = ((y2 - y1) / (x2 - x1)) * (x - x1) + y1    # 直線の式
y = y.subs({x1:2, y1:3, x2:6, y2:5})            # 式に値を代入
y
\[\displaystyle \frac{x}{2} + 2\]
# -*- coding: utf-8 -*-
import matplotlib
import matplotlib.pyplot as plt
import numpy as np
import sympy as sp
import math

# グラフ画像の保存先ファイルパス
save_fig_path = "./data/L006-01_4.png"

fig = plt.figure()
ax = fig.add_subplot(111)

# 中心(2,3)で半径3の円を描画
circle = plt.Circle((2, 3), 3, ec='#96514d', fill=False)
ax.add_patch(circle)

# 中心(6,5)で半径3の円を描画
circle = plt.Circle((6, 5), 3, ec='#96514d', fill=False)
ax.add_patch(circle)

# 2つの円の中心を結ぶ線を描画
def func(x1):
    return x1/2 +2

x1 = np.arange(2, 7)
y1 = func(x1)

plt.plot(x1, y1)

# 2つの円の中心と等距離にある直線を描画
def func(x2):
    return 12 - 2*x2

x2 = np.arange(2, 7)
y2 = func(x2)

plt.plot(x2, y2)

plt.grid(color = '0.8')
plt.axis('equal')
plt.scatter(2, 3, color = '#96514d')
plt.scatter(6, 5, color = '#96514d')
plt.show()

# グラフをファイルに保存
fig.savefig(save_fig_path)
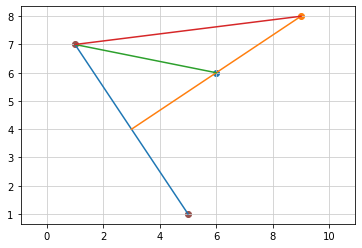
3点から等しい距離にある点
垂直二等分線上の点を中心に円を描く
### 垂直二等分線上の点を中心に円を描く ###
#
# 点A と 点B とを結ぶ直線の式

# -*- coding: utf-8 -*-
import matplotlib
import matplotlib.pyplot as plt
import numpy as np
import sympy as sp
import math

x = sp.Symbol('x')               # 未知数 x
x1, y1 = sp.symbols('x1, y1')    # 点m の座標
x2, y2 = sp.symbols('x2, y2')    # 点n の座標

y = ((y2 - y1) / (x2 - x1)) * (x - x1) + y1    # 直線の式
y = y.subs({x1:1, y1:7, x2:5, y2:1})            # 式に値を代入
y
\[\displaystyle \frac{17}{2} - \frac{3 x}{2}\]
# 垂直二等分線の式

import sympy as sp
sp.init_printing()

# 記号を定義
x, y = sp.symbols('x, y')
x1, y1 = sp.symbols('x1, y1')    # 点A
x2, y2 = sp.symbols('x2, y2')    # 点B

# 式を定義(AP ** 2 - BP ** 2 = 0)
expr = ((x - x1) ** 2 + ( y- y1) ** 2) - ((x - x2) ** 2 + ( y- y2) ** 2)
display(expr)

# 式を y について解く
ans = sp.solve(expr, y)
display(ans)

# 式に値を代入して expr を上書き
expr = expr.subs({x1:1, y1:7, x2:5, y2:1})
display(expr)

# 式を y について解く
ans = sp.solve(expr, y)
ans
\[\displaystyle \left(x - x_{1}\right)^{2} - \left(x - x_{2}\right)^{2} + \left(y - y_{1}\right)^{2} - \left(y - y_{2}\right)^{2}\]
\[\displaystyle \left[ \frac{y_{1}^{2} - y_{2}^{2} + \left(x - x_{1}\right)^{2} - \left(x - x_{2}\right)^{2}}{2 \left(y_{1} - y_{2}\right)}\right]\]
\[\displaystyle - \left(x - 5\right)^{2} + \left(x - 1\right)^{2} + \left(y - 7\right)^{2} - \left(y - 1\right)^{2}\]
\[\displaystyle \left[ \frac{2 x}{3} + 2\right]\]
# 垂直二等分線上の 点C と 点A を結ぶ直線の式

x = sp.Symbol('x')               # 未知数 x
x1, y1 = sp.symbols('x1, y1')    # 点m の座標
x2, y2 = sp.symbols('x2, y2')    # 点n の座標

y = ((y2 - y1) / (x2 - x1)) * (x - x1) + y1    # 直線の式
y = y.subs({x1:6, y1:6, x2:1, y2:7})            # 式に値を代入
y
\[\displaystyle \frac{36}{5} - \frac{x}{5}\]
x = sp.Symbol('x')               # 未知数 x
x1, y1 = sp.symbols('x1, y1')    # 点m の座標
x2, y2 = sp.symbols('x2, y2')    # 点n の座標

y = ((y2 - y1) / (x2 - x1)) * (x - x1) + y1    # 直線の式
y = y.subs({x1:9, y1:8, x2:1, y2:7})            # 式に値を代入
y
\[\displaystyle \frac{x}{8} + \frac{55}{8}\]
# -*- coding: utf-8 -*-
import matplotlib
import matplotlib.pyplot as plt
import numpy as np
import sympy as sp
import math

# グラフ画像の保存先ファイルパス
save_fig_path = "./data/L006-05_1.png"

fig = plt.figure()
ax = fig.add_subplot(111)

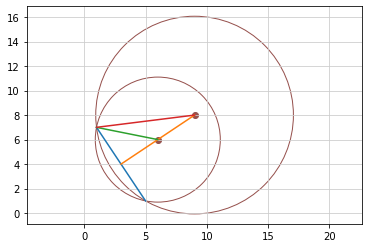
# 2つの点A(1,7)、点B(5,1)を結ぶ線を描画
def func(x1):
    return -x1*3/2 + 17/2

x1 = np.arange(1, 6)
y1 = func(x1)

plt.plot(x1, y1)

# 2つの点の垂直二等分線を描画
def func(x2):
    return 2*x2/3 + 2

x2 = np.arange(3, 10)
y2 = func(x2)

plt.plot(x2, y2)

# 2つの点C(6,6)、点A(1,7)を結ぶ線を描画
def func(x3):
    return -x3/5 + 36/5

x3 = np.arange(1, 7)
y3 = func(x3)

plt.plot(x3, y3)

# 2つの点D(9,8)、点A(1,7)を結ぶ線を描画
def func(x4):
    return x4/8 + 55/8

x4 = np.arange(1, 10)
y4 = func(x4)

plt.plot(x4, y4)

plt.grid(color = '0.8')
plt.axis('equal')
plt.scatter(1, 7, color = '#96514d')
plt.scatter(5, 1, color = '#96514d')
plt.scatter(6, 6)
plt.scatter(9, 8)
plt.show()

# グラフをファイルに保存
fig.savefig(save_fig_path)
# 点AC間 の距離

import math

def dist(x1, y1, x2, y2):
    return math.sqrt((x2 - x1)**2 + (y2 - y1)**2)

dat = dist(6, 6, 1, 7)
print('点AC間の距離 = ', dat)
点AC間の距離 = 5.0990195135927845
# 点AD間 の距離

import math

def dist(x1, y1, x2, y2):
    return math.sqrt((x2 - x1)**2 + (y2 - y1)**2)

dat = dist(9, 8, 1, 7)
print('点AD間の距離 = ', dat)
点AD間の距離 = 8.06225774829855
# -*- coding: utf-8 -*-
import matplotlib
import matplotlib.pyplot as plt
import numpy as np
import sympy as sp
import math

# グラフ画像の保存先ファイルパス
save_fig_path = "./data/L006-05_2.png"

fig = plt.figure()
ax = fig.add_subplot(111)

# 中心(9,8)で半径ADの円を描画
circle = plt.Circle((9, 8), 8.06225774829855, ec='#96514d', fill=False)
ax.add_patch(circle)

# 中心(6,6)で半径ACの円を描画
circle = plt.Circle((6, 6), 5.0990195135927845, ec='#96514d', fill=False)
ax.add_patch(circle)

# 2つの点A(1,7)、点B(5,1)を結ぶ線を描画
def func(x1):
    return -x1*3/2 + 17/2

x1 = np.arange(1, 6)
y1 = func(x1)

plt.plot(x1, y1)

# 2つの点の垂直二等分線を描画
def func(x2):
    return 2*x2/3 + 2

x2 = np.arange(3, 10)
y2 = func(x2)

plt.plot(x2, y2)

# 2つの点C(6,6)、点A(1,7)を結ぶ線を描画
def func(x3):
    return -x3/5 + 36/5

x3 = np.arange(1, 7)
y3 = func(x3)

plt.plot(x3, y3)

# 2つの点D(9,8)、点A(1,7)を結ぶ線を描画
def func(x4):
    return x4/8 + 55/8

x4 = np.arange(1, 10)
y4 = func(x4)

plt.plot(x4, y4)

plt.grid(color = '0.8')
plt.axis('equal')
plt.scatter(9, 8, color = '#96514d')
plt.scatter(6, 6, color = '#96514d')
plt.show()

# グラフをファイルに保存
fig.savefig(save_fig_path)
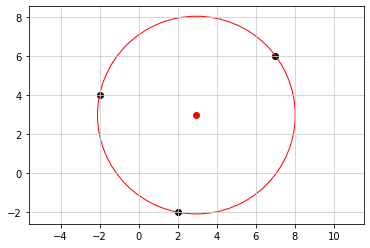
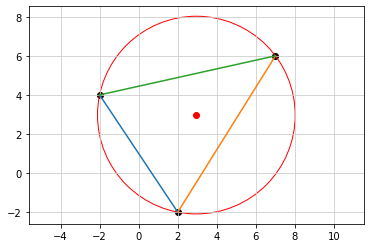
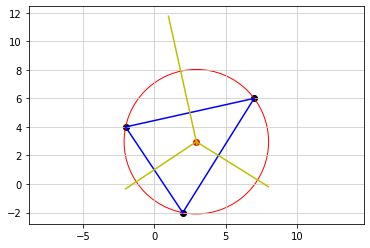
# 点A(-2,4)、点B(2,-2)、点C(7,6) の三点から等距離にある点
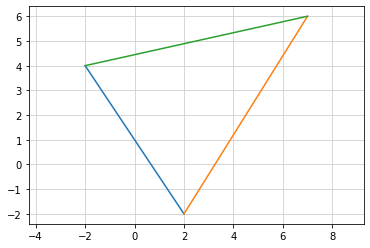
# 点A、点B、点C それぞれの間を結ぶと三角形ができる
# 各辺の垂直二等分線を引くと 点P で交わる
# 点P は外心 で 外接円 の中心となる

import math

# グラフ画像の保存先ファイルパス
save_fig_path = "./data/L006-05_3.png"

fig = plt.figure()
ax = fig.add_subplot(111)

# 数式で使う文字の定義
x, y = sp.symbols('x, y')

# 垂直二等分線の式
def perp_bisector(p1, p2):
    ex = ((x-p1[0])**2 + (y-p1[1])**2) - ((p2[0]-x)**2 + (p2[1]-y)**2)
    ex = sp.solve(ex, y)
    return sp.Eq(y, ex[0])

# 2点間の距離
def dist_p2p(p1, p2):
    return math.sqrt((p2[0]-p1[0])**2 + (p2[1]-p1[1])**2)

# ----------

# 3点の座標
x1 = -2; y1= 4
x2 = 2; y2 = -2
x3 = 7; y3 = 6

# 線分AB の垂直二等分線の式
expr1 = perp_bisector((x1, y1), (x2, y2))
display(expr1)

# 線分BC の垂直二等分線の式
expr2 = perp_bisector((x2, y2), (x3, y3))
display(expr2)

# 垂直二等分線の 交点P
p = sp.solve([expr1, expr2])
display(p)

# 点A と 点P との距離
r = dist_p2p((x1, y1), (p[x], p[y]))
display(r)

# 点を描画
plt.scatter(x1, y1, color = 'k')
plt.scatter(x2, y2, color = 'k')
plt.scatter(x3, y3, color = 'k')
plt.scatter(p[x], p[y], color = 'r')

# 円を描画
circle = plt.Circle((p[x], p[y]), r, fill = False, ec = 'r')
ax = plt.gca()
ax.add_patch(circle)

plt.grid(color = '0.8')
plt.axis('equal')
plt.show()

# グラフをファイルに保存
fig.savefig(save_fig_path)
\[\displaystyle y = \frac{2 x}{3} + 1\]
\[\displaystyle y = \frac{77}{16} - \frac{5 x}{8}\]
{x: 183/62, y: 92/31}
5.058065544766189
# 点A と 点B とを結ぶ直線の式

# -*- coding: utf-8 -*-
import matplotlib
import matplotlib.pyplot as plt
import numpy as np
import sympy as sp
import math

x = sp.Symbol('x')               # 未知数 x
x1, y1 = sp.symbols('x1, y1')    # 点m の座標
x2, y2 = sp.symbols('x2, y2')    # 点n の座標

y = ((y2 - y1) / (x2 - x1)) * (x - x1) + y1    # 直線の式
y = y.subs({x1:-2, y1:4, x2:7, y2:8})            # 式に値を代入
y
\[\displaystyle \frac{4 x}{9} + \frac{44}{9}\]
# 点A と 点B とを結ぶ直線の式

# -*- coding: utf-8 -*-
import matplotlib
import matplotlib.pyplot as plt
import numpy as np
import sympy as sp
import math

x = sp.Symbol('x')               # 未知数 x
x1, y1 = sp.symbols('x1, y1')    # 点A の座標
x2, y2 = sp.symbols('x2, y2')    # 点B の座標
x3, y3 = sp.symbols('x3, y3')    # 点C の座標

def f(x):
    return  ((y2 - y1) / (x2 - x1)) * (x - x1) + y1

y3 = f(x).subs({x1:7, y1:6, x2:-2, y2:4})
print('y3 = ', y3)

y1 = f(x).subs({x1:-2, y1:4, x2:2, y2:-2})
print('y1 = ', y1)

y2 = f(x).subs({x1:7, y1:6, x2:2, y2:-2})
print('y2 = ', y2)
y3 =  2*x/9 + 40/9
y1 =  1 - 3*x/2
y2 =  8*x/5 - 26/5
# 3点の座標
# x1 = -2; y1= 4
# x2 = 2; y2 = -2
# x3 = 7; y3 = 6

x_1 = np.arange(-2, 3)
y_1 = 1 - 3*x_1/2

plt.plot(x_1, y_1)

x_2 = np.arange(2, 8)
y_2 = 8*x_2/5 - 26/5

plt.plot(x_2, y_2)

x_3 = np.arange(-2, 8)
y_3 = 2*x_3/9 + 40/9

plt.plot(x_3, y_3)

plt.grid(color = '0.8')
plt.axis('equal')
plt.show()
# -*- coding: utf-8 -*-
import matplotlib
import matplotlib.pyplot as plt
import numpy as np
import sympy as sp
import math

# グラフ画像の保存先ファイルパス
save_fig_path = "./data/L006-05_4.png"

fig = plt.figure()
ax = fig.add_subplot(111)

# 数式で使う文字の定義
x, y = sp.symbols('x, y')

# 垂直二等分線の式
def perp_bisector(p1, p2):
    ex = ((x-p1[0])**2 + (y-p1[1])**2) - ((p2[0]-x)**2 + (p2[1]-y)**2)
    ex = sp.solve(ex, y)
    return sp.Eq(y, ex[0])

# 2点間の距離
def dist_p2p(p1, p2):
    return math.sqrt((p2[0]-p1[0])**2 + (p2[1]-p1[1])**2)

# ----------

# 3点の座標
x1 = -2; y1= 4
x2 = 2; y2 = -2
x3 = 7; y3 = 6

# 線分AB の垂直二等分線の式
expr1 = perp_bisector((x1, y1), (x2, y2))

# 線分BC の垂直二等分線の式
expr2 = perp_bisector((x2, y2), (x3, y3))

# 垂直二等分線の 交点P
p = sp.solve([expr1, expr2])

# 点A と 点P との距離
r = dist_p2p((x1, y1), (p[x], p[y]))

# 点を描画
plt.scatter(x1, y1, color = 'k')
plt.scatter(x2, y2, color = 'k')
plt.scatter(x3, y3, color = 'k')
plt.scatter(p[x], p[y], color = 'r')

# 円を描画
circle = plt.Circle((p[x], p[y]), r, fill = False, ec = 'r')
ax = plt.gca()
ax.add_patch(circle)

# 線を描画
x_1 = np.arange(-2, 3)
y_1 = 1 - 3*x_1/2

plt.plot(x_1, y_1)

x_2 = np.arange(2, 8)
y_2 = 8*x_2/5 - 26/5

plt.plot(x_2, y_2)

x_3 = np.arange(-2, 8)
y_3 = 2*x_3/9 + 40/9

plt.plot(x_3, y_3)

plt.grid(color = '0.8')
plt.axis('equal')
plt.show()

# グラフをファイルに保存
fig.savefig(save_fig_path)
# -*- coding: utf-8 -*-
import matplotlib
import matplotlib.pyplot as plt
import numpy as np
import sympy as sp
import math

# グラフ画像の保存先ファイルパス
save_fig_path = "./data/L006-05_5.png"

fig = plt.figure()
ax = fig.add_subplot(111)

# 数式で使う文字の定義
x, y = sp.symbols('x, y')

# 垂直二等分線の式
def perp_bisector(p1, p2):
    ex = ((x-p1[0])**2 + (y-p1[1])**2) - ((p2[0]-x)**2 + (p2[1]-y)**2)
    ex = sp.solve(ex, y)
    return sp.Eq(y, ex[0])

# 2点間の距離
def dist_p2p(p1, p2):
    return math.sqrt((p2[0]-p1[0])**2 + (p2[1]-p1[1])**2)

# ----------

# 3点の座標
x1 = -2; y1= 4
x2 = 2; y2 = -2
x3 = 7; y3 = 6

# 線分AB の垂直二等分線の式
expr1 = perp_bisector((x1, y1), (x2, y2))

# 線分BC の垂直二等分線の式
expr2 = perp_bisector((x2, y2), (x3, y3))

# 垂直二等分線の 交点P
p = sp.solve([expr1, expr2])

# 点A と 点P との距離
r = dist_p2p((x1, y1), (p[x], p[y]))

# 点を描画
plt.scatter(x1, y1, color = 'k')
plt.scatter(x2, y2, color = 'k')
plt.scatter(x3, y3, color = 'k')
plt.scatter(p[x], p[y], color = 'r')

# 円を描画
circle = plt.Circle((p[x], p[y]), r, fill = False, ec = 'r')
ax = plt.gca()
ax.add_patch(circle)

# 線を描画
x_1 = np.arange(-2, 3)
y_1 = 1 - 3*x_1/2

plt.plot(x_1, y_1, color ='b')

x_2 = np.arange(2, 8)
y_2 = 8*x_2/5 - 26/5

plt.plot(x_2, y_2, color ='b')

x_3 = np.arange(-2, 8)
y_3 = 2*x_3/9 + 40/9

plt.plot(x_3, y_3, color = 'b')

# 垂直二等分線を表示

abx = np.arange(-2, 4)
aby = 2*abx/3 + 1

plt.plot(abx, aby, color = 'y')

bcx = np.arange(3, 9)
bcy = -5*bcx/8 + 77/16

plt.plot(bcx, bcy, color = 'y')

cax = np.arange(1, 4)
cay = -9*cax/2 + 65/4

plt.plot(cax, cay, color = 'y')

plt.grid(color = '0.8')
plt.axis('equal')
plt.show()

# グラフをファイルに保存
fig.savefig(save_fig_path)
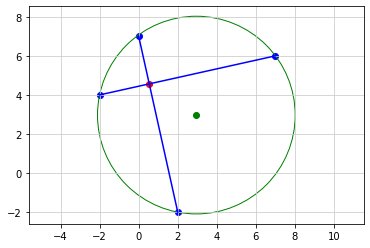
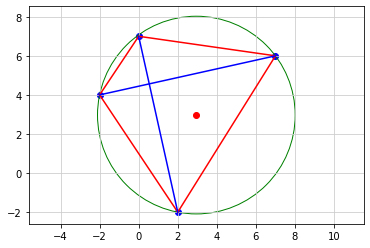
点が4つ以上¥あるとき
点と直線の関係
2点から等距離にある点は複数あり、それを集めると直線になる
3点から等距離にある点は1つしかない
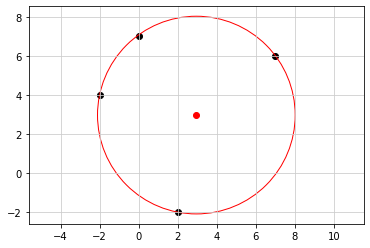
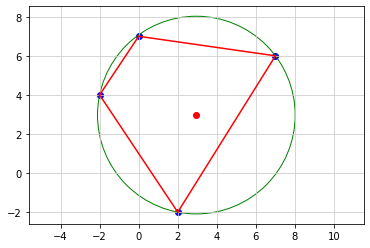
4点から等距離にある点は円の中心となる
3点からの場合と同じ
5点以上でも同様
# -*- coding: utf-8 -*-
import matplotlib
import matplotlib.pyplot as plt
import numpy as np
import sympy as sp
import math

# グラフ画像の保存先ファイルパス
save_fig_path = "./data/L006-06_1.png"

fig = plt.figure()
ax = fig.add_subplot(111)

# 数式で使う文字の定義
x, y = sp.symbols('x, y')

# 垂直二等分線の式
def perp_bisector(p1, p2):
    ex = ((x-p1[0])**2 + (y-p1[1])**2) - ((p2[0]-x)**2 + (p2[1]-y)**2)
    ex = sp.solve(ex, y)
    return sp.Eq(y, ex[0])

# 2点間の距離
def dist_p2p(p1, p2):
    return math.sqrt((p2[0]-p1[0])**2 + (p2[1]-p1[1])**2)

# ----------

# 4点の座標
x1 = -2; y1= 4
x2 = 2; y2 = -2
x3 = 7; y3 = 6
x4 = 0; y4 = 7

# 線分AB の垂直二等分線の式
expr1 = perp_bisector((x1, y1), (x2, y2))

# 線分BC の垂直二等分線の式
expr2 = perp_bisector((x2, y2), (x3, y3))

# 垂直二等分線の 交点P
p = sp.solve([expr1, expr2])
display(p)

# 点A と 点P との距離
r = dist_p2p((x1, y1), (p[x], p[y]))
display(r)

# 点を描画
plt.scatter(x1, y1, color = 'k')
plt.scatter(x2, y2, color = 'k')
plt.scatter(x3, y3, color = 'k')
plt.scatter(x4, y4, color = 'k')
plt.scatter(p[x], p[y], color = 'r')

# 円を描画
circle = plt.Circle((p[x], p[y]), r, fill = False, ec = 'r')
ax = plt.gca()
ax.add_patch(circle)

plt.grid(color = '0.8')
plt.axis('equal')
plt.show()

# グラフをファイルに保存
fig.savefig(save_fig_path)
{x: 183/62, y: 92/31}
5.058065544766189
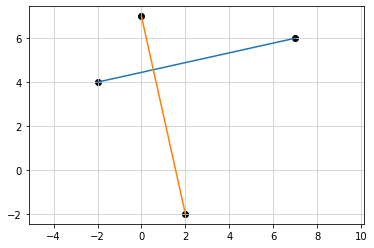
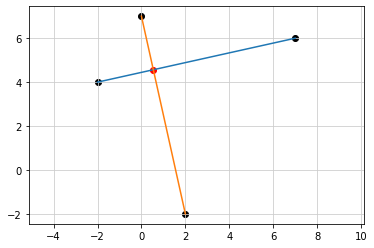
### 方べきの定理 ###

# -*- coding: utf-8 -*-
import matplotlib
import matplotlib.pyplot as plt
import numpy as np
import sympy as sp
import math

# 4点の座標
x1 = -2; y1= 4
x2 = 2; y2 = -2
x3 = 7; y3 = 6
x4 = 0; y4 = 7

x = sp.Symbol('x')               # 未知数 x
x1, y1 = sp.symbols('x1, y1')    # 点m の座標
x2, y2 = sp.symbols('x2, y2')    # 点n の座標

def func(x):
    return ((y2 - y1) / (x2 - x1)) * (x - x1) + y1    # 直線の式

y_a = func(x).subs({x1:-2, y1:4, x2:7, y2:6})
print(y_a)

y_b =  func(x).subs({x1:2, y1:-2, x2:0, y2:7})
print(y_b)
2*x/9 + 40/9
7 - 9*x/2
# グラフ画像の保存先ファイルパス
save_fig_path = "./data/L006-06_2.png"

fig = plt.figure()
ax = fig.add_subplot(111)

# 4点の座標
x1 = -2; y1= 4
x2 = 2; y2 = -2
x3 = 7; y3 = 6
x4 = 0; y4 = 7

# 2つの点A(-2,4)、点C(7,6)を結ぶ線を描画

def func(x1):
    return 2*x1/9 + 40/9

x_1 = np.arange(-2, 8)
y_1 = func(x_1)

plt.plot(x_1, y_1)

# 2つの点B(2,-2)、点D(0,7)を結ぶ線を描画

def func(x2):
    return 7 - 9*x2/2

x_2 = np.arange(0, 3)
y_2 = func(x_2)

plt.plot(x_2, y_2)

# 点を描画
plt.scatter(x1, y1, color = 'k')
plt.scatter(x2, y2, color = 'k')
plt.scatter(x3, y3, color = 'k')
plt.scatter(x4, y4, color = 'k')

plt.grid(color = '0.8')
plt.axis('equal')
plt.show()

# グラフをファイルに保存
fig.savefig(save_fig_path)
# -*- coding: utf-8 -*-
import matplotlib
import matplotlib.pyplot as plt
import numpy as np
import sympy as sp
import math

x = sp.Symbol('x')               # 未知数 x
x1, y1 = sp.symbols('x1, y1')    # 点m の座標
x2, y2 = sp.symbols('x2, y2')    # 点n の座標

def func(x):
    return ((y2 - y1) / (x2 - x1)) * (x - x1) + y1    # 直線の式

y_ab = func(x).subs({x1:-2, y1:4, x2:2, y2:-2})
print(y_ab)

y_bc =  func(x).subs({x1:2, y1:-2, x2:7, y2:6})
print(y_bc)
1 - 3*x/2
8*x/5 - 26/5
y_cd = func(x).subs({x1:7, y1:6, x2:0, y2:7})
print(y_cd)

y_bc =  func(x).subs({x1:0, y1:7, x2:-2, y2:4})
print(y_bc)
7 - x/7
3*x/2 + 7
# グラフ画像の保存先ファイルパス
save_fig_path = "./data/L006-06_3.png"

x = sp.Symbol('x')               # 未知数 x
x1, y1 = sp.symbols('x1, y1')    # 点m の座標
x2, y2 = sp.symbols('x2, y2')    # 点n の座標

# 4点の座標
x1 = -2; y1= 4
x2 = 2; y2 = -2
x3 = 7; y3 = 6
x4 = 0; y4 = 7

fig = plt.figure()
ax = fig.add_subplot(111)

# 数式で使う文字の定義
x, y = sp.symbols('x, y')

# 線分AB の垂直二等分線の式
expr1 = perp_bisector((x1, y1), (x2, y2))

# 線分BC の垂直二等分線の式
expr2 = perp_bisector((x2, y2), (x3, y3))

# 垂直二等分線の 交点P
p = sp.solve([expr1, expr2])

# 2点間の距離
def dist_p2p(p1, p2):
    return math.sqrt((p2[0]-p1[0])**2 + (p2[1]-p1[1])**2)

x_1 = np.arange(-2, 3)
y_1 = 1- 3*x_1/2

plt.plot(x_1, y_1, color = 'r')

x_2 = np.arange(2, 8)
y_2 = 8*x_2/5 - 26/5

plt.plot(x_2, y_2, color = 'r')

x_3 = np.arange(0, 8)
y_3 = 7 - x_3/7

plt.plot(x_3, y_3, color = 'r')

x_4 = np.arange(-2, 1)
y_4 = 3*x_4/2 + 7

plt.plot(x_4, y_4, color = 'r')

# 点A と 点P との距離
r = dist_p2p((x1, y1), (p[x], p[y]))

# 点を描画
plt.scatter(x1, y1, color = 'b')
plt.scatter(x2, y2, color = 'b')
plt.scatter(x3, y3, color = 'b')
plt.scatter(x4, y4, color = 'b')
plt.scatter(p[x], p[y], color = 'r')

# 円を描画
circle = plt.Circle((p[x], p[y]), r, fill = False, ec = 'g')
ax = plt.gca()
ax.add_patch(circle)

plt.grid(color = '0.8')
plt.axis('equal')
plt.show()

# グラフをファイルに保存
fig.savefig(save_fig_path)
# -*- coding: utf-8 -*-
import matplotlib
import matplotlib.pyplot as plt
import numpy as np
import sympy as sp
import math

# グラフ画像の保存先ファイルパス
save_fig_path = "./data/L006-06_4.png"

fig = plt.figure()
ax = fig.add_subplot(111)

x = sp.Symbol('x')               # 未知数 x
x1, y1 = sp.symbols('x1, y1')    # 点m の座標
x2, y2 = sp.symbols('x2, y2')    # 点n の座標

# 4点の座標
x1 = -2; y1= 4
x2 = 2; y2 = -2
x3 = 7; y3 = 6
x4 = 0; y4 = 7

# 数式で使う文字の定義
x, y = sp.symbols('x, y')

# 垂直二等分線の式
def perp_bisector(p1, p2):
    ex = ((x-p1[0])**2 + (y-p1[1])**2) - ((p2[0]-x)**2 + (p2[1]-y)**2)
    ex = sp.solve(ex, y)
    return sp.Eq(y, ex[0])

# 2点間の距離
def dist_p2p(p1, p2):
    return math.sqrt((p2[0]-p1[0])**2 + (p2[1]-p1[1])**2)

# 線分AB の垂直二等分線の式
expr1 = perp_bisector((x1, y1), (x2, y2))

# 線分BC の垂直二等分線の式
expr2 = perp_bisector((x2, y2), (x3, y3))

# 垂直二等分線の 交点P
p = sp.solve([expr1, expr2])

x_1 = np.arange(-2, 3)
y_1 = 1- 3*x_1/2

plt.plot(x_1, y_1, color = 'r')

x_2 = np.arange(2, 8)
y_2 = 8*x_2/5 - 26/5

plt.plot(x_2, y_2, color = 'r')

x_3 = np.arange(0, 8)
y_3 = 7 - x_3/7

plt.plot(x_3, y_3, color = 'r')

x_4 = np.arange(-2, 1)
y_4 = 3*x_4/2 + 7

plt.plot(x_4, y_4, color = 'r')

# 点A と 点P との距離
r = dist_p2p((x1, y1), (p[x], p[y]))

# 2つの点A(-2,4)、点C(7,6)を結ぶ線を描画

def func(x1):
    return 2*x1/9 + 40/9

x_1 = np.arange(-2, 8)
y_1 = func(x_1)

plt.plot(x_1, y_1, color = 'b')

# 2つの点B(2,-2)、点D(0,7)を結ぶ線を描画

def func(x2):
    return 7 - 9*x2/2

x_2 = np.arange(0, 3)
y_2 = func(x_2)

plt.plot(x_2, y_2, color = 'b')

# 点を描画
plt.scatter(x1, y1, color = 'b')
plt.scatter(x2, y2, color = 'b')
plt.scatter(x3, y3, color = 'b')
plt.scatter(x4, y4, color = 'b')
plt.scatter(p[x], p[y], color = 'r')

# 円を描画
circle = plt.Circle((p[x], p[y]), r, fill = False, ec = 'g')
ax = plt.gca()
ax.add_patch(circle)

plt.grid(color = '0.8')
plt.axis('equal')
plt.show()

# グラフをファイルに保存
fig.savefig(save_fig_path)
### 方べきの定理 ###

# -*- coding: utf-8 -*-
import matplotlib
import matplotlib.pyplot as plt
import numpy as np
import sympy as sp
import math

# 4点の座標
x1 = -2; y1= 4
x2 = 2; y2 = -2
x3 = 7; y3 = 6
x4 = 0; y4 = 7

x = sp.Symbol('x')               # 未知数 x
y = sp.Symbol('y')               # 未知数 Y
x1, y1 = sp.symbols('x1, y1')    # 点m の座標
x2, y2 = sp.symbols('x2, y2')    # 点n の座標

def func(x):
    return ((y2 - y1) / (x2 - x1)) * (x - x1) + y1    # 直線の式

y_a = func(x).subs({x1:-2, y1:4, x2:7, y2:6})
print(y_a)

y_b =  func(x).subs({x1:2, y1:-2, x2:0, y2:7})
print(y_b)

x = sp.Symbol('x')


ty = sp.Eq(y, y_a)
jy = sp.Eq(y, y_b)

ans = sp.solve([ty, jy])
ans
2*x/9 + 40/9
7 - 9*x/2
{x: 46/85, y: 388/85}
# グラフ画像の保存先ファイルパス
save_fig_path = "./data/L006-06_5.png"

# 2つの点A(-2,4)、点C(7,6)を結ぶ線を描画

fig = plt.figure()
ax = fig.add_subplot(111)

# 4点の座標
x1 = -2; y1= 4
x2 = 2; y2 = -2
x3 = 7; y3 = 6
x4 = 0; y4 = 7

# 2つの点A(-2,4)、点C(7,6)を結ぶ線を描画

def func(x1):
    return 2*x1/9 + 40/9

x_1 = np.arange(-2, 8)
y_1 = func(x_1)

plt.plot(x_1, y_1)

# 2つの点B(2,-2)、点D(0,7)を結ぶ線を描画

def func(x2):
    return 7 - 9*x2/2

x_2 = np.arange(0, 3)
y_2 = func(x_2)

plt.plot(x_2, y_2)

x = 46/85
y = 388/85

# 点を描画
plt.scatter(x1, y1, color = 'k')
plt.scatter(x2, y2, color = 'k')
plt.scatter(x3, y3, color = 'k')
plt.scatter(x4, y4, color = 'k')
plt.scatter(x, y, color = 'r')

plt.grid(color = '0.8')
plt.axis('equal')
plt.show()

# グラフをファイルに保存
fig.savefig(save_fig_path)
import matplotlib
import matplotlib.pyplot as plt
import numpy as np
import sympy as sp
import math

x = sp.Symbol('x')               # 未知数 x
x1, y1 = sp.symbols('x1, y1')    # 点m の座標
x2, y2 = sp.symbols('x2, y2')    # 点n の座標

# 4点の座標
x1 = -2; y1= 4
x2 = 2; y2 = -2
x3 = 7; y3 = 6
x4 = 0; y4 = 7

# 交点の座標
x = 46/85; y = 388/85

# 点AX間 の距離

def dist(x1, y1, x2, y2):
    return math.sqrt((x2 - x1)**2 + (y2 - y1)**2)

a = dist(x1, y1, x, y)
print('点AX間の距離 = ', a)

d = dist(x2, y2, x, y)
print('点BX間の距離 = ', d)

b = dist(x3, y3, x, y)
print('点CX間の距離 = ', b)

c = dist(x4, y4, x, y)
print('点DX間の距離 = ', c)

ab = a * b
cd = c * d

print(ab, cd)
点AX間の距離 =  2.603165493823874
点BX間の距離 =  6.724844192378341
点CX間の距離 =  6.616378963469014
点DX間の距離 =  2.494700264914546
17.22352941176471 16.776470588235295
# -*- coding: utf-8 -*-
import matplotlib
import matplotlib.pyplot as plt
import numpy as np
import sympy as sp
import math

# グラフ画像の保存先ファイルパス
save_fig_path = "./data/L006-06_6.png"

fig = plt.figure()
ax = fig.add_subplot(111)

x = sp.Symbol('x')               # 未知数 x
x1, y1 = sp.symbols('x1, y1')    # 点m の座標
x2, y2 = sp.symbols('x2, y2')    # 点n の座標

# 4点の座標
x1 = -2; y1= 4
x2 = 2; y2 = -2
x3 = 7; y3 = 6
x4 = 0; y4 = 7

# 数式で使う文字の定義
x, y = sp.symbols('x, y')

# 垂直二等分線の式
def perp_bisector(p1, p2):
    ex = ((x-p1[0])**2 + (y-p1[1])**2) - ((p2[0]-x)**2 + (p2[1]-y)**2)
    ex = sp.solve(ex, y)
    return sp.Eq(y, ex[0])

# 2点間の距離
def dist_p2p(p1, p2):
    return math.sqrt((p2[0]-p1[0])**2 + (p2[1]-p1[1])**2)

# 線分AB の垂直二等分線の式
expr1 = perp_bisector((x1, y1), (x2, y2))

# 線分BC の垂直二等分線の式
expr2 = perp_bisector((x2, y2), (x3, y3))

# 垂直二等分線の 交点P
p = sp.solve([expr1, expr2])


# 点A と 点P との距離
r = dist_p2p((x1, y1), (p[x], p[y]))

# 2つの点A(-2,4)、点C(7,6)を結ぶ線を描画

def func(x1):
    return 2*x1/9 + 40/9

x_1 = np.arange(-2, 8)
y_1 = func(x_1)

plt.plot(x_1, y_1, color = 'b')

# 2つの点B(2,-2)、点D(0,7)を結ぶ線を描画

def func(x2):
    return 7 - 9*x2/2

x_2 = np.arange(0, 3)
y_2 = func(x_2)

plt.plot(x_2, y_2, color = 'b')

# 交点の座標
cx = 46/85; cy = 388/85

# 点を描画
plt.scatter(x1, y1, color = 'b')
plt.scatter(x2, y2, color = 'b')
plt.scatter(x3, y3, color = 'b')
plt.scatter(x4, y4, color = 'b')
plt.scatter(p[x], p[y], color = 'g')
plt.scatter(cx, cy, color = 'r')

# 円を描画
circle = plt.Circle((p[x], p[y]), r, fill = False, ec = 'g')
ax = plt.gca()
ax.add_patch(circle)

plt.grid(color = '0.8')
plt.axis('equal')
plt.show()

# グラフをファイルに保存
fig.savefig(save_fig_path)
